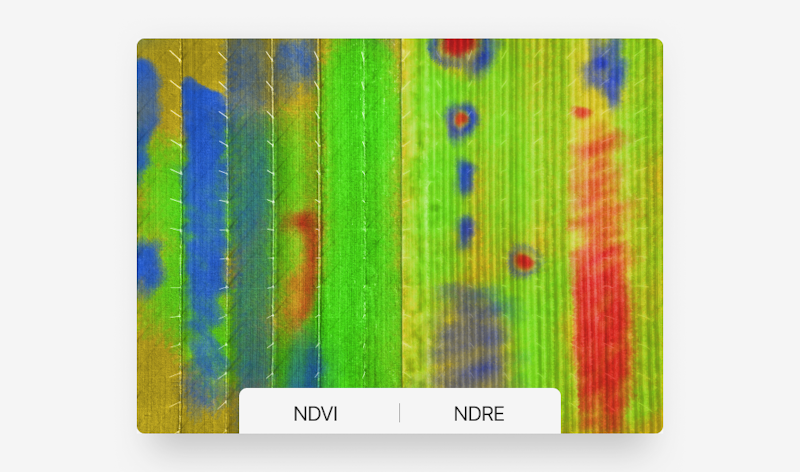
With remote sensing through satellite imagery increasingly popular as a form of crop monitoring, we often get questions about the three most common imagery types available: RGB, NDVI and NDRE. The use case for RGB, Red Green Blue - or a ‘normal image’, is easy to understand, but NDVI and NDRE are more technical, and so I’d like to take some time to explain the differences and use cases of each.
NDVI and NDRE are both remote sensing indices commonly used to assess vegetation health and monitor crop conditions. They rely on the analysis of light reflected by plants at different wavelengths to indicate their physiological status.
NDVI - Normalized Difference Vegetation Index
NDVI is calculated by comparing the reflectance of near-infrared (NIR) and red light wavelengths. This index provides information about the overall greenness and vigor of vegetation. It is particularly useful for monitoring crop growth, detecting stress factors, and estimating biomass production. Some use cases for NDVI include:
- Crop health assessment: NDVI values can indicate the presence of pests, diseases, nutrient deficiencies, or water stress in crops. While NDVI can give an indication of where a problem might be occurring, in-field validation (ground-truthing) is still required to diagnose the exact issue
- Growth monitoring: NDVI can track changes in vegetation cover and growth patterns over time, helping clients assess the effectiveness of management practices.
- Yield prediction: By analyzing NDVI values during the growing season, clients can estimate crop yields and make data-driven decisions for harvesting and marketing.

NDRE - Normalized Difference Red Edge
NDRE uses a similar principle to NDVI but compares red-edge and red light wavelengths instead. The red-edge portion of the electromagnetic spectrum is sensitive to changes in chlorophyll content, making NDRE particularly effective for assessing plant vigor and nitrogen status. Some use cases for NDRE include:
- Nitrogen management: NDRE can help growers optimize nitrogen fertilizer applications by identifying areas of crops that require additional nutrients or where excess fertilization may have occurred.
- Crop stress detection: NDRE values can reveal early signs of stress caused by factors such as nutrient imbalances, drought, or disease, allowing growers to take prompt corrective actions. Again, ground-truthing of the exact issues is still required.
- Variability mapping: By mapping the spatial variability of NDRE values across a field, clients can identify areas with differing levels of crop vigor or health, facilitating targeted interventions.
RGB, NDRE and NDVI data layers from some of the most popular satellite data providers are available through Leaf’s unified API. If you’d like to find out more about how Leaf simplifies your access to this data and helps you control your costs, please send me a message.


